The Spectrum Analyzer
The spectrum analyzer is used to examine the frequency spectrum of radar transmissions, local oscillators, test sets, and any other equipment operating within its testable frequency range.
With experience, you will be able to determine definite areas of malfunctioning components within equipment. Successful spectrum analysis depends on the proper operation of the spectrum analyzer and your ability to correctly interpret the displayed frequencies. Although there are many types of spectrum analyzers, we will use the Tektronix, Model 492 for our discussion.
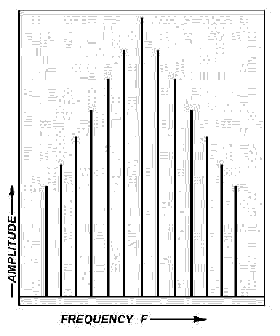
The spectrum analyzer accepts an electrical input signal and displays the frequency and amplitude of the signal on a CRT. On the vertical, or Y, axis, the amplitude is plotted. The frequency would then be found on the horizontal, or X, axis. The overall pattern of this display (the figure below) indicates the proportion of power present at the various frequencies within the spectrum analyzer (fundamental frequency with sideband frequencies).

The Spectrum Analyzer pattern.
BASIC FUNCTIONAL DESCRIPTION OF THE SPECTRUM ANALYZER
The model 492 analyzer can be divided into six basic sections, as follows:
· Converter section;
· Intermediate frequency (IF) section;
· Display section;
· Frequency control section;
· Digital control section; and
· Power and cooling section.
Converter Section
The converter section actually consists of three frequency converters, made up of a mixer, local oscillator (LO), and required filters. Only one frequency can be converted at a time and pass through the filters to reach the next converter. The analysis frequency can, however, be changed by altering the frequency of the LO and adjusting the FREQUENCY control knob.
FIRST CONVERTER
The first (front end) converter changes the input signal to a usable IF signal that will either be 829 MHz or 2072 MHz. The IF signal to be produced is dependent on which measurement band selection is currently being used. The 829 MHz IF signal will be selected for bands 2 through 4, while the 2072 MHz IF signal is selected for bands 1 and 5 through 11.
SECOND CONVERTER
The second converter actually contains two converters. Only one of these two converters in this section is ever operational, and selected as a result of the measurement band currently being used. The selected converter will convert the frequency received from the first converter to a usable (110 MHz) IF signal, which is then provided to the third converter.
THIRD CONVERTER
This
converter takes the 110 MHz IF signal, amplifies it, and then converts
it to the final IF of 10 MHz. This signal, in turn, is then passed on to
the IF section.
IF Section
The IF section of the spectrum analyzer receives the final IF signal and uses it to establish the system resolution by using selective filtering. System resolution is selected under microcomputer control among five bandwidths (1 MHz, 100 kHz, 10 kHz, 1 kHz, and 100 Hz). The gain for all bands are then leveled and logarithmically amplified. This is done so that each division of signal change on the CRT display remains equal in change to every other division on the CRT.
For example, in the 10-dB-per-division mode, each division of change is equal to a 10 dB difference, regardless of whether the signal appears at the top or bottom of the CRT. The signal needed to produce the video output to the display section is then detected and provided.
Display Section
The display section provides a representative display of the input signal on the CRT. It accomplishes this by performing the following functions:
· Receives the video signals from the IF section and processes these signals to adjust the vertical drive of the CRT;
· Receives the sweep voltages and processes these signals to produce the horizontal CRT drive plate voltage;
· Receives character data information and generates CRT plate drive signals to display alpha and numeric characters on the CRT;
· Receives control levels from the front panel beam controls and generates unblanking signals to control display presence, brightness, and focus.
The vertical deflection of the beam is increased as the output of the amplitude detector increases. The horizontal position is controlled by the frequency control section and is the frequency analyzed at that instant. The beam sweeps from left to right, low to high frequencies during its analysis. During this analysis, any time a signal is discovered, a vertical deflection will show the strength of the signal at the horizontal position that is the frequency. This results in a display of amplitude as a function of frequency.
Frequency Control Section
The frequency control section accomplishes the tuning of the first and second LOs within the converter section. The frequency immediately being analyzed is controlled by the current frequencies of the LOs. To analyze another frequency, you must change an LO frequency to allow the new frequency to be converted to a 10 MHz signal by the converter section. Periodically, the unit sweeps and analyzes a frequency range centered on the frequency set by the FREQUENCY knob. Adjusting the FREQUENCY knob will cause the LOs to be tuned to the new frequency. Only the LOs of the first two converters can be changed to vary the frequency being analyzed.
Digital Control Section
All the internal functions are controlled from the front panel through the use of a built-in microcomputer. The microcomputer uses an internal bus to receive or produce all communication or control to any section of the analyzer.
Power and Cooling Section
The main power supply provides almost all the regulated voltages required to operate the unit. The display section provides the high voltage necessary for CRT operation.
The cooling system
allows fresh cool air to be routed to all sections of the unit in
proportion to the heat that is generated by each section.
Spectrum-analyzer-controls, indicators, and connectors


